
With SAP focusing on cloud-based analytics, SAP Analytics Cloud (SAC) is becoming one of the most sort after tools in the SAP BI space. SAC is more of a self-service solution on the cloud, hence, there was a constant business need for a professionally authored dash-boarding tool on the cloud. SAP now has a solution for this in the form of Analytics Designer.
Analytics Designer has many features that makes it interactive. For this purpose, it uses, tables, charts, various widgets and script logic to bind all these together.
In this blog, we will see the use of script logic for enabling the dropdown feature in Analytics Designer. We will be using the dropdown to select the account dimension member and the table output will change dynamically as per the selection.
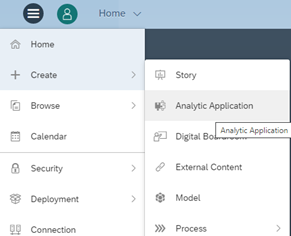
- Create a new Analytic Designer Application.
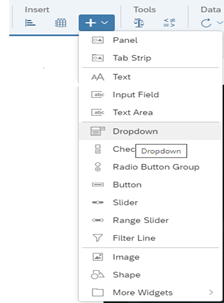
- Add a table and a dropdown in the analytic designer canvas; one can also add a background image and a text box.
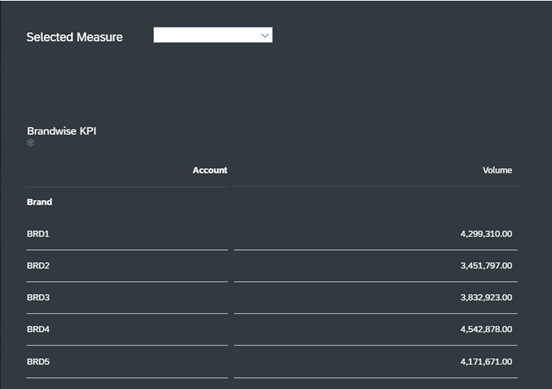
Table Parameters:
Rows – Brand
Column – Account (Filtered on a member)
Once the structure is ready, we can include the script logic.
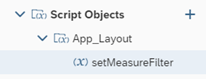
- Create a Class and function (Argument: String, Return Type: Void) in the script objects panel.
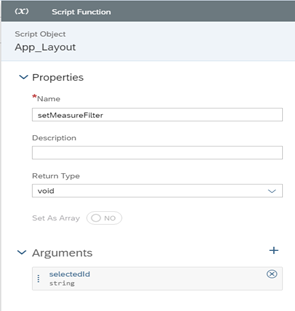
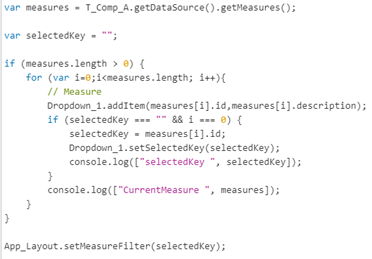
- Add the below logic in the script function to modify the table dimension as per the dropdown selection.
Note: Replace the function argument as per the dimension name of the model.
- Go to edit script on the canvas and include the below logic in ‘oninitialization’ function to retrieve the Account dimension members of the model.
Note: Replace the table name as per the configuration.
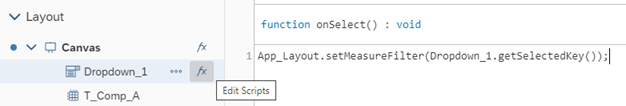
- Edit the dropdown widget script to call the script function ‘App_Layout.setMeasureFilter’.
To run the application, save it and click on Run Analytic Application Button.
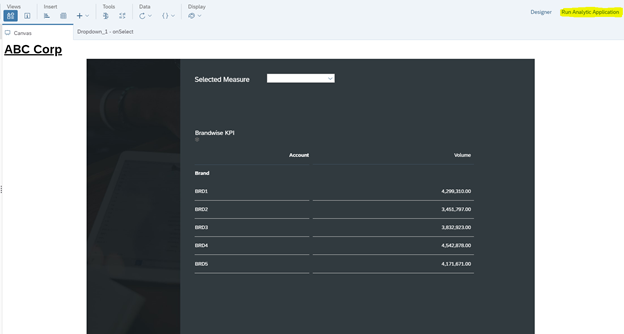
Output: Table dimension will change as per the dropdown selection.